 Comparison
Long-Term Cost Savings of Electrostatic Disinfection
Table of Contents
- How Electrostatic Disinfection Works and Why Cost Matters
- Electrostatic Disinfection Cost Breakdown: What You Actually Pay
- Electrostatic Disinfection vs Traditional Disinfection: A Cost Comparison
- Calculating Electrostatic Disinfection ROI for Your Facility
- Electrostatic Sprayer vs Fogger: Which Saves More Over Time
- Real-World Scenarios: Where Electrostatic Disinfection Breaks Even Fastest
- Frequently Asked Questions
Last Updated: October 21, 2026
How Electrostatic Disinfection Works and Why Cost Matters
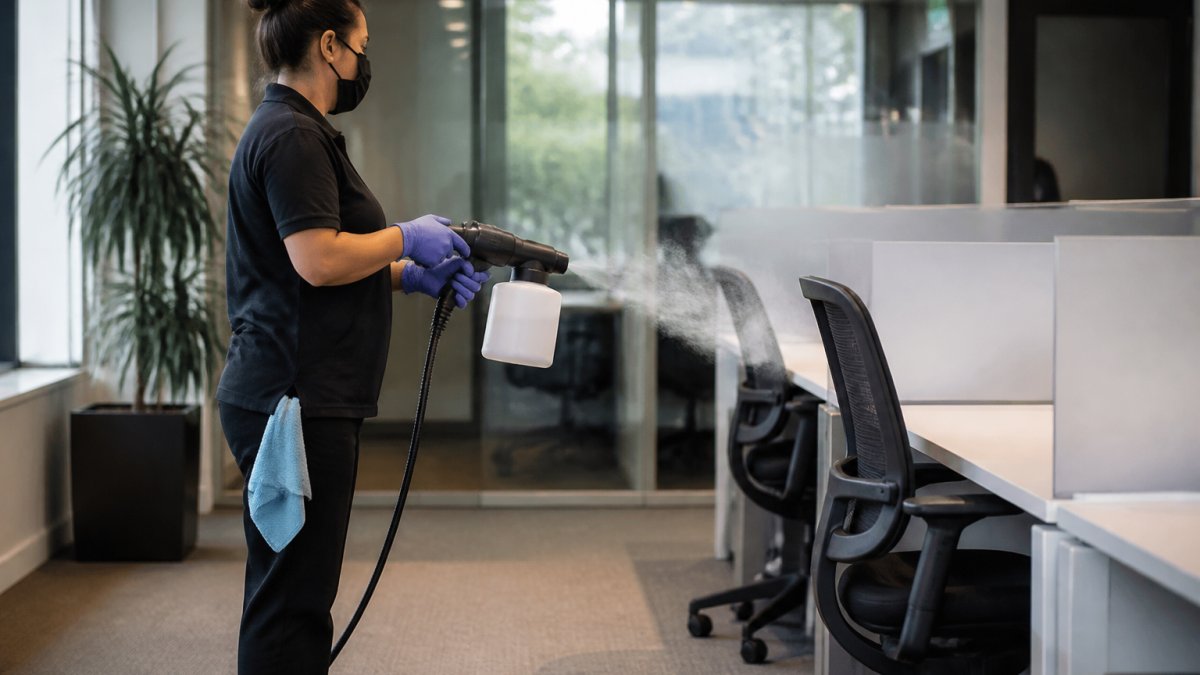
Electrostatic disinfection applies charged droplets of disinfectant to surfaces, achieving wraparound coverage that reaches areas traditional methods miss. Understanding the long term cost savings of electrostatic disinfection requires looking beyond the equipment purchase price to labor, consumables, application time, and total cost of ownership across multiple treatment cycles.
At Rangel Janitorial, we've spent over 30 years evaluating cleaning and disinfection methods for commercial facilities. The lowest upfront cost rarely delivers the lowest long-term expense, electrostatic disinfection changes the math on labor and operational efficiency when calculated correctly.
The real decision isn't whether electrostatic disinfection is "better", it's whether the long term cost savings of electrostatic disinfection justify the capital investment, which depends on square footage, treatment frequency, current labor costs, and how you measure success.
Electrostatic Disinfection Cost Breakdown: What You Actually Pay
A defensible total cost of ownership (TCO) model has seven line items, and the long term cost savings of electrostatic disinfection only appear when all seven are modeled over the same treatment scope you use today.
1. Equipment (capital or service). You can buy a handheld or backpack electrostatic sprayer, lease one, or contract a service provider.
2. Consumables. This covers EPA-registered disinfectant concentrate, dilution supplies, and replacement nozzles, tanks, and seals. Two variables drive it: the label dilution rate and the application rate per 1,000 square feet.
3. Labor. Labor is typically the largest line in any disinfection budget and the one electrostatic application most directly changes. Savings come from time per treatment, not from paying crews less.
4. Training. One-time or annual refresher cost for equipment operation, PPE use, dilution, and label compliance. Small but real, and it recurs with staff turnover.
5. Maintenance and replacement. Nozzles clog, electrodes and seals wear, batteries degrade, and sprayers eventually need repair or replacement.
6. Operational and compliance costs. These are routinely omitted and can erase a thin savings margin:
- PPE for applicators (gloves, eye protection, respiratory protection where the label requires it).
- Dwell time, the wet contact time the label requires. Faster application does not shorten it.
- Ventilation and re-entry, some products and spaces require ventilation or a re-entry interval, forcing scheduling around occupancy and adding labor.
- Label compliance, using a product outside its label directions is a violation, so the disinfectant constrains how and where you spray.
- Recordkeeping, administrative time for inspection or accreditation documentation belongs in the model.
7. Disposal and storage. Concentrate storage, mixed-solution shelf life (mixed product loses potency and must be discarded), and empty-container disposal.
A simple TCO worksheet looks like this:
| Cost line | Current method (annual) | Electrostatic (annual) |
|---|---|---|
| Equipment / service | $ | $ |
| Consumables | $ | $ |
| Labor (hours x burdened rate) | $ | $ |
| Training | $ | $ |
| Maintenance / replacement reserve | $ | $ |
| PPE, dwell, ventilation, compliance | $ | $ |
| Disposal / storage | $ | $ |
| Total | $ | $ |
Fill it with your own numbers. Vendor claims about percentage labor savings are no substitute for your facility's time study; results vary by workflow, surface density, product label, and pathogen target.
Electrostatic Disinfection vs Traditional Disinfection: A Cost Comparison
Traditional disinfection relies on manual spray-and-wipe or fogging: staff move through a space, spray each surface, and allow dwell time before wiping, labor-intensive and slow.
Electrostatic spraying covers more square footage faster because charged droplets wrap around surfaces and reach crevices without manual contact. Since labor represents 60-75% of most facility cleaning budgets, reducing application time makes the long term cost savings of electrostatic disinfection visible in payroll.
For facilities with high-touch surfaces, frequent treatment, or large square footage, electrostatic disinfection typically wins on total cost of ownership. For small spaces treated occasionally, traditional methods may remain more cost-effective.
| Method | Equipment Cost | Labor per 10K sq ft | Consumable Cost | Coverage Speed | Best For |
|---|---|---|---|---|---|
| Manual spray-and-wipe | Low | High | Low | Slow | Small spaces, occasional use |
| Electrostatic spraying | Medium to High | Low | Medium | Fast | Large facilities, frequent treatment |
| Fogging | Low to Medium | Medium | Medium | Medium | Open spaces, routine disinfection |
A common mistake is assuming electrostatic disinfection saves money immediately. It doesn't. You must reach a break-even point where labor savings accumulate enough to offset equipment and training costs. That break-even varies by facility, typically 6-18 months for active facilities.
Calculating Electrostatic Disinfection ROI for Your Facility
ROI depends on four inputs you control: treatment scope, treatment frequency, burdened labor rate, and equipment path. Compute payback for your own building instead of borrowing a vendor's percentage.
Step 1, Establish the baseline with a time study, not an estimate. Time one crew member performing your current protocol on a representative area (e.g., 5,000 square feet of mixed office space).
Step 2, Time the electrostatic protocol on the same scope. Use the same surface list, dwell time, and pre-cleaning steps. Record minutes, solution used, and any added setup or ventilation/re-entry time.
Step 3, Convert to annual dollars.
Annual labor savings = (minutes saved per treatment / 60) x burdened hourly rate x treatments per year.
Use a burdened rate (wages plus payroll taxes and benefits), not a bare wage, or you will overstate payback.
Step 5, Compute payback and multi-year ROI.
Payback (months) = upfront investment / (net annual savings / 12).
Multi-year ROI = (cumulative net savings over N years - upfront investment) / upfront investment.
Worked example with stated assumptions. A 50,000-square-foot facility treats high-touch and common areas three times per week (about 150 treatments per year).
Sensitivity table. Because time savings are the dominant variable, model a range rather than a point estimate:
| Labor time reduction | Gross annual labor savings | Net annual savings (after $5,100 added costs) | Payback on $12,000 |
|---|---|---|---|
| 20% | $5,040 | -$60 | Does not pay back |
| 35% | $8,820 | $3,720 | ~39 months |
| 50% | $12,600 | $7,500 | ~19 months |
| 65% | $16,380 | $11,280 | ~13 months |
(The dollar figures above are illustrative and derived from the stated assumptions; substitute your own time-study and rate data.)
Separate measured results from vendor claims. Published labor-reduction percentages often assume ideal conditions: open floor plans, low clutter, and a single pass.
Facility-specific patterns. The economics shift by setting because area, occupancy, and treatment frequency change together:
- Healthcare and dental operatories: high treatment frequency and strict dwell/re-entry requirements; labor savings are large but compliance costs are also highest.
- Schools and childcare: large treated area, moderate frequency, and scheduling constraints around occupancy; savings depend on whether treatment can happen while spaces are empty.
- Offices: moderate area and frequency; payback is sensitive to whether you treat all surfaces or high-touch points only.
- Gyms and fitness centers: high-touch equipment and locker rooms drive frequent treatment; labor intensity favors electrostatic application.
- Warehouses and industrial spaces: very large area, lower surface density; labor savings per square foot can be strong, but equipment durability and maintenance matter more.
Electrostatic Sprayer vs Fogger: Which Saves More Over Time
Electrostatic sprayers and foggers both cover faster than manual methods, but they work differently and carry different cost profiles.
Electrostatic sprayers use charged droplets that adhere to surfaces and wrap around objects, requiring less dwell time and allowing safer treatment of occupied spaces. Labor time is typically lower because application is precise and fast.
Foggers disperse disinfectant as a mist into open spaces, requiring longer dwell times and typically vacated spaces. Fogging works for routine open-area disinfection but is less efficient for targeting high-touch surfaces.
For the long term cost savings of electrostatic disinfection to exceed fogging, you need frequent high-touch surface treatment. Electrostatic sprayers excel at targeted disinfection. Foggers excel at broad-area disinfection.
Electrostatic sprayers cost more upfront; foggers are cheaper to acquire but may use more consumable volume per treatment because coverage is less efficient.
Choose electrostatic spraying if your facility has high-touch surfaces and frequent treatment schedules. Choose fogging if you need periodic broad-area disinfection with minimal labor. The long term cost savings of electrostatic disinfection emerge only in high-frequency scenarios.
Real-World Scenarios: Where Electrostatic Disinfection Breaks Even Fastest
Break-even timing varies by facility type and treatment frequency. Medical and dental practices break even fastest because they require frequent disinfection and carry high manual-application labor costs.
A dental practice treating 8-10 operatories 2-3 times daily sees labor savings immediately: electrostatic application takes minutes per operatory versus 15-20 minutes for manual spray-and-wipe. Break-even occurs within 6-12 months.
Corporate offices treating 1-2 times weekly see longer break-even periods, typically 12-18 months, but past break-even the long term cost savings of electrostatic disinfection compound over years.
Industrial facilities with large square footage and routine schedules break even within 10-14 months, since treated volume makes labor efficiency the dominant cost factor.
Gyms and fitness centers with high-touch equipment and locker rooms requiring frequent sanitization break even within 8-12 months, as frequent treatment and high labor intensity favor electrostatic application.
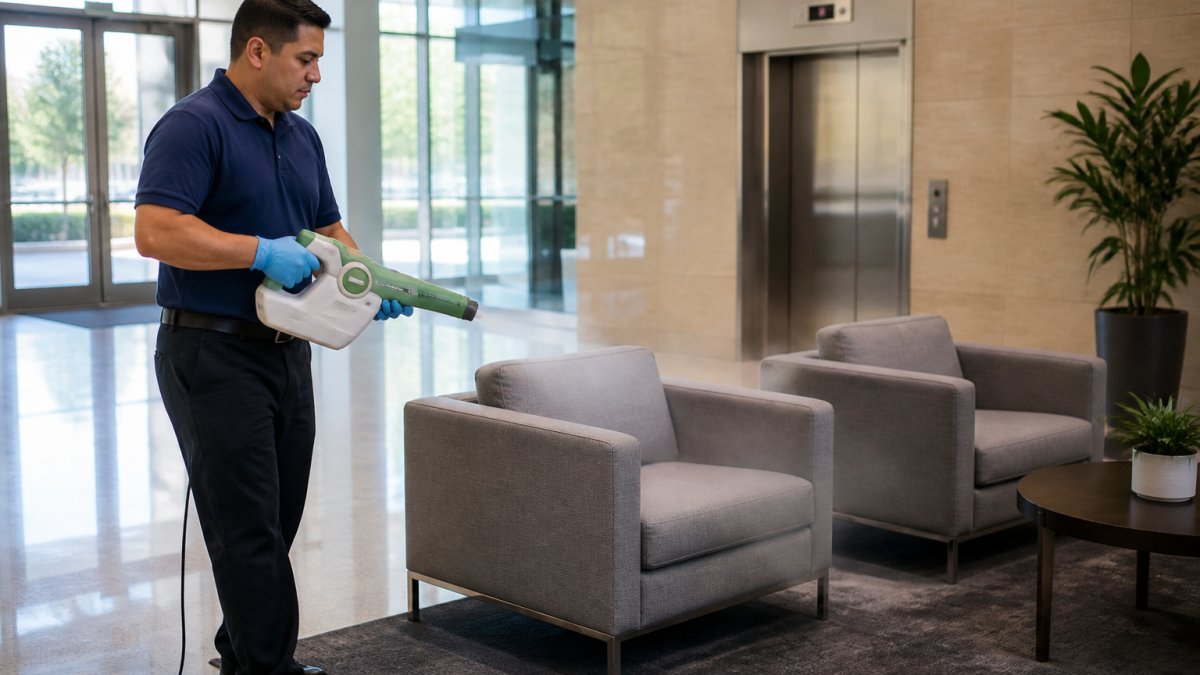
Small offices with infrequent treatment (monthly or less) may never break even on equipment investment; traditional methods remain more cost-effective.
The long term cost savings of electrostatic disinfection accelerate after break-even. Year two and beyond show compounding savings as equipment investment is recovered and labor efficiency continues.
Making the right decision about electrostatic disinfection requires modeling your specific facility's costs and treatment schedule. We offer tailored electrostatic disinfection with 360-degree coverage and trained professional crews. Get a free quote and let us show you the real numbers for your space.
Frequently Asked Questions
How can businesses calculate the long-term cost savings of electrostatic disinfection?
Start by documenting your current disinfection costs: labor hours per week, hourly rates, disinfectant volume used, and treatment frequency. Then compare against electrostatic disinfection by calculating labor time reduction (typically 40-50% faster coverage), disinfectant consumption savings, and reduced treatment frequency. Divide total equipment and setup costs by monthly savings to find your payback period. Include maintenance and consumable costs in the ongoing expense total. Facilities with larger square footage and high-traffic areas see faster payback.
Is electrostatic disinfection more cost-effective than traditional disinfection?
Long-term, yes, but the timeline depends on facility size and current method. Electrostatic disinfection reduces labor time and cuts disinfectant use through efficient application. The timeline for positive ROI varies by facility size and current methods. Traditional spray-and-wipe methods require ongoing labor and higher disinfectant volumes, making electrostatic disinfection more economical over 2-3 years.
What factors affect the cost of electrostatic disinfection?
Key factors include facility square footage, layout complexity (hard-to-reach surfaces increase value), current labor costs, treatment frequency, equipment choice (sprayer vs. fogger), and EPA-registered disinfectant type. High-touch surface density and foot traffic also matter, medical facilities and gyms see greater savings because they require more frequent disinfection. Training costs and maintenance schedules add to the initial investment. Facilities with multiple locations can spread equipment costs across properties, improving ROI.
Are disinfectant foggers worth it compared with electrostatic sprayers?
Electrostatic sprayers typically deliver better ROI for most commercial facilities. Sprayers provide 360-degree wraparound coverage with precise droplet control, reducing disinfectant waste and dwell time. Foggers work well for enclosed spaces and post-event sanitization but use more solution and take longer to clear areas for re-entry. For ongoing facility disinfection, electrostatic sprayers cost less to operate per treatment and allow faster facility access, making them the better long-term investment for offices, medical practices, and gyms.