 How-to
How to Improve Facility Hygiene With Data-Driven Auditing
Last Updated: October 27, 2026
Quick Summary
Data-driven auditing improves facility hygiene by scoring the same areas the same way on every visit, so each finding becomes a record you can sort, trend, and review. Build a consistent checklist, track a few calculable KPIs, and let the results decide where to act next.
- Write checklist items specific enough that two inspectors would give the same score.
- Track three to five KPIs, such as audit pass rate, missed-task rate, and repeat-finding rate.
- Set tighter targets for high-risk zones like restrooms and medical exam rooms.
- Schedule inspections by risk tier: daily spot checks and weekly audits for high-risk areas.
- Rotate inspectors and run spot checks so scores mean the same thing across visits.
Table of Contents
- Why Data-Driven Auditing Beats Walk-Through Inspections
- Step 1: Build a Facility Cleaning Audit Checklist That Scores Consistently
- Step 2: Set Commercial Cleaning KPIs You Can Calculate
- Step 3: Collect Reliable Audit Data in the Field
- Step 4: Choose Cleaning Audit Software That Fits Your Workflow
- Step 5: Set Cleaning Inspection Frequency by Risk Area
- Scheduling Your First Data-Driven Audit With Rangel Janitorial
- Frequently Asked Questions
Why Data-Driven Auditing Beats Walk-Through Inspections
A walk-through inspection depends on one person, one visit, and one memory. The inspector notices the dusty vent or the streaky glass, writes a note, and moves on. Next month, the notes are hard to compare. Was the restroom in Building B better or worse than last quarter? Nobody can say for sure.
Data-driven auditing fixes this by scoring the same areas the same way, every time. Each finding becomes a record you can sort, trend, and review. That is the core of improving facility hygiene with data driven auditing: you stop reacting to what you happen to see and start tracking what keeps happening.
- Scores stay consistent across inspectors and visits
- Repeat problems show up as patterns, not one-off complaints
- Records give you proof for tenants, clients, and audits
The shift is simple. Less guessing, more evidence.
Step 1: Build a Facility Cleaning Audit Checklist That Scores Consistently
A facility cleaning audit checklist is the foundation of the whole process. If the checklist is vague, the data will be vague too. Write each item so two different inspectors would give it the same score.
Start by dividing the building into zones: restrooms, lobbies, break rooms, medical exam rooms, locker rooms, and high-touch surfaces. Then list the specific items in each zone.
Use a simple scoring scale, such as pass, needs attention, or fail. Avoid scales with too many options, because they invite inconsistent scoring.
A common mistake is writing items like "Restroom looks clean." Replace that with "Toilet, sink, and floor free of visible soil, residue, or odor." Specific wording removes arguments later.
Where your site has special requirements, add them as scored criteria. A dental operatory or a gym's equipment room may need their own line items.
Step 2: Set Commercial Cleaning KPIs You Can Calculate
Key performance indicators, or KPIs, turn audit results into numbers you can track over time. The best KPIs are ones you can calculate directly from your checklist without extra work, and the ones that survive review are the ones with a written formula, a target, and a named owner.
Start with a small set. Pick three to five KPIs at most. More than that, and nobody reviews them. Set a target for each one and review the numbers on a fixed schedule, weekly for high-risk zones, monthly for the rest of the building.
Core facility hygiene metrics and how to calculate them
Audit pass rate. Divide the number of items that passed by the total items inspected, then multiply by 100. If 88 of 100 items pass, your pass rate is 88 percent.
Missed-task rate. Divide the number of scheduled tasks with no evidence of completion by the total scheduled tasks in the period, then multiply by 100. This is the metric that catches skipped work, not just poor work.
Surface pass rate. Restrict the pass rate to high-touch and high-risk surfaces, door handles, light switches, faucets, shared keyboards, exam tables, and calculate it separately.
Repeat-finding rate. Divide the number of findings that reappear after being marked closed by the total findings closed in the period, then multiply by 100.
Average time to correct. Subtract the date a finding was logged from the date it was verified closed, then average across all findings in the period. Report it in days. Pair it with a target such as "high-risk findings closed within 48 hours" so the number has meaning.
Score trend. Track the change in overall score month over month, and flag any zone that drops more than a set threshold, for example, five points, between audits. Trend is a signal to investigate, not a grade.
Set targets that reflect risk, not aspiration
A single building-wide target hides too much. Set targets by tier. High-risk zones such as restrooms, medical exam rooms, food areas, and high-touch surfaces should carry the tightest targets, a surface pass rate of 95 percent or higher and a high-risk corrective action closed within 48 hours are common starting points. Medium-risk zones such as lobbies, conference rooms, and break rooms can run at a slightly lower pass-rate target with a one-week correction window. Lower-risk zones such as storage areas and low-traffic offices can be reviewed monthly.
Targets should be reviewed, not carved in stone. If a zone holds its target for several consecutive months, tighten it or reduce inspection frequency. If a zone misses repeatedly, the target is not the problem, the workflow is, and the repeat-finding rate will show it.
Review cadence and what to do with the numbers
Put the KPIs on a fixed review rhythm so they drive action instead of sitting in a report. A workable pattern is a weekly fifteen-minute review of high-risk zone pass rates and open corrective actions, and a monthly review of trends, repeat findings, and time to correct across the whole facility. At each review, answer three questions: which zones are below target, which findings are past due, and which problems have appeared more than once. Those three answers generate the next round of corrective actions.
Keep the raw audit records behind the KPIs. A pass rate without the underlying checklist entries, photos, and timestamps cannot be defended to a client, a tenant, or an auditor, and it cannot be used to find the root cause of a repeat finding.
Step 3: Collect Reliable Audit Data in the Field
Good data depends on how it is collected.
Write a scoring rubric before the first walk
A checklist item is only as good as the rubric behind it. For each item, define what a pass, a needs-attention, and a fail look like in observable terms. "Restroom floor" is not a rubric. "Floor free of visible soil, standing water, and debris at the time of inspection; pass if none observed, needs attention if soil is confined to one area smaller than a floor tile, fail if soil or water is present across the walking path" is a rubric two people can apply the same way.
Keep the scale short. Pass, needs attention, and fail is enough for most facilities. Five- and seven-point scales invite disagreement and slow the walk down. If you need more nuance, add a separate severity field for corrective-action prioritization rather than expanding the score.
Build a sampling plan instead of inspecting everything
You cannot inspect every surface in a large facility on every visit, and you do not need to. A sampling plan tells you how many items to check and where, so the score is representative rather than lucky.
Record the sample size with the score. A 95 percent pass rate on ten items and a 95 percent pass rate on one hundred items are not the same evidence, and the record should make that clear.
Set inspection frequency by risk, then let the data adjust it
Frequency should follow risk, not habit. A workable starting point uses three tiers:
- High risk: daily spot checks and weekly full audits for restrooms, medical exam rooms, food areas, and high-touch surfaces
- Medium risk: weekly audits for lobbies, conference rooms, and break rooms
- Lower risk: monthly audits for storage areas and low-traffic offices
Adjust the tiers as data comes in. A zone that fails repeatedly moves up a tier until scores stabilize.
Calibrate auditors so scores mean the same thing
Repeat the calibration exercise on a schedule, and always when a new inspector joins or a checklist changes. Rotate inspectors across zones so no one scores the same building every month, and have a second person spot-check a sample of areas to catch drift. An inspector who knows the building manager well may go easier on a space without meaning to; rotation and spot checks are the cheapest defense against that bias.
Capture evidence at the point of inspection
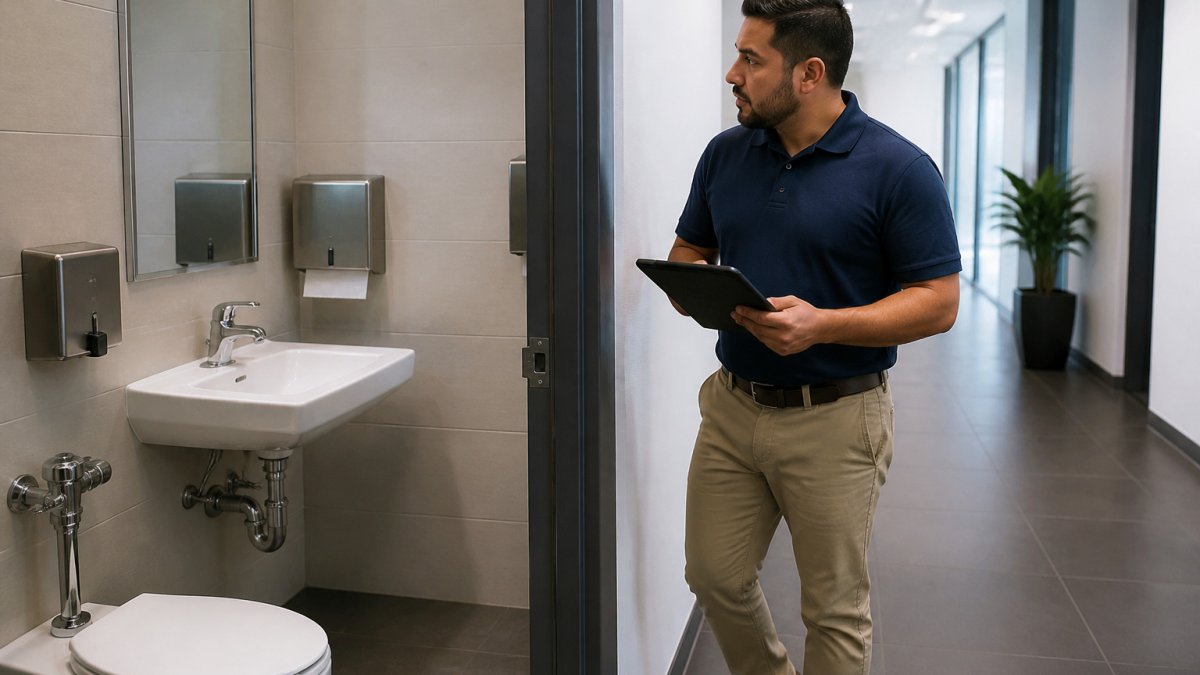
Record findings on a tablet or phone during the walk, not from memory afterward. Timestamp each entry, tie it to a zone and a checklist item, and attach a photo when an issue is unclear or likely to be disputed. Walk the same route in the same order each visit so results are comparable and areas do not get skipped.
Step 4: Choose Cleaning Audit Software That Fits Your Workflow
Look for a few core features:
- Mobile forms that work offline in restrooms, basements, and parking structures
- Photo attachments tied to specific checklist items
- Dashboards that show KPI trends by site and zone
- Corrective action tracking with assignments and due dates
- Exportable reports for clients, tenants, or auditors
Step 5: Set Cleaning Inspection Frequency by Risk Area
A workable approach uses three tiers:
- High risk: daily spot checks and weekly full audits for restrooms, medical exam rooms, food areas, and high-touch surfaces
- Medium risk: weekly audits for lobbies, conference rooms, and break rooms
- Lower risk: monthly audits for storage areas and offices with low traffic
The article recommends scheduling inspections by risk tier, so this table summarises the suggested frequency for each area.
| Risk tier | Areas | Inspection frequency |
|---|---|---|
| High risk | Restrooms, medical exam rooms, food areas, high-touch surfaces | Daily spot checks, weekly full audits |
| Medium risk | Lobbies, conference rooms, break rooms | Weekly audits |
| Lower risk | Storage areas, low-traffic offices | Monthly audits |
Scheduling Your First Data-Driven Audit With Rangel Janitorial
Rangel Janitorial has more than 30 years of experience, uses fully bonded and insured professional crews, and offers specialized electrostatic disinfection with 360-degree coverage.
Get Free Quote.
Frequently Asked Questions
How do you conduct a facility hygiene audit?
Start by defining the areas, surfaces and tasks in scope, then score each one against a fixed checklist during a walk-through. Record results on a tablet or app so every inspector uses the same criteria. Photograph failures, tag them by zone and priority, and compare scores across weeks. Repeat the same route and timing each cycle so the trend data stays comparable, and feed the findings into a corrective action list with owners and due dates.
How often should a facility conduct cleaning audits?
Most facilities set inspection frequency by risk. High-traffic restrooms, break rooms, medical exam areas and gym locker rooms usually warrant weekly or more frequent checks, while low-traffic offices may be reviewed monthly. Review your failure rates after each quarter. If a zone fails repeatedly, increase its inspection frequency until the scores stabilize, then reduce it again.
Which KPIs measure cleaning and hygiene performance?
Useful commercial cleaning KPIs include audit pass rate by zone, percentage of tasks completed on schedule, number of open corrective actions, average days to close a failed item, and repeat-failure rate for the same area. Calculate each one from the same audit records every period so the figures can be compared. Avoid vanity metrics that look good but do not show whether surfaces were actually cleaned.
What tools can be used to track cleaning inspections?
Cleaning audit software can store checklists, timestamped photos, scores and corrective actions in one place. Look for offline capture for areas with weak connectivity, role-based access so vendors see only their own sites, exportable reports for client reviews, and the ability to attach the same checklist to multiple buildings. Spreadsheets can work for a small portfolio, but they make version control and trend analysis harder as the number of sites grows.